EasyLog
A multi-log analyzer with a dedicated dashboard for every log type.
EasyLog ingests logs over syslog, parses each source by type, stores the parsed events in an embedded DuckDB column store, and serves a live dashboard per log type — all from a single, self-contained binary. Instead of a wall of raw text, you get clear metrics, charts, and drill-down tailored to each source.
Architecture
graph TD
    A["Log sources (Apache, Nginx, Traefik …)"] -->|"rsyslog → syslog UDP/TCP :514"| B["EasyLog ingest engine (Rust / Axum)"]
    B -->|"route by source IP"| C{"Log type"}
    C -->|apache| D["Apache parser"]
    C -->|nginx| E["Nginx parser"]
    C -->|traefik| F["Traefik JSON parser"]
    D --> G[("DuckDB (columnar store)")]
    E --> G
    F --> G
    G -->|"live SQL aggregations"| H["Per-type dashboards · Web UI :3000"]
Incoming syslog messages are routed to a parser by the sending host's IP, which you map to a log type in the web UI. Parsed events are stored as rows — the source of truth — and every dashboard is a live SQL query over them, so you can always drill down to the underlying requests.
Features
- Syslog ingestion over both UDP and TCP (RFC 3164 & RFC 5424).
- Pluggable log types — each type owns its parser, storage schema, and dashboard.
- DuckDB storage — parsed events stored as rows; dashboards run live analytical SQL, so new views never need a re-ingest.
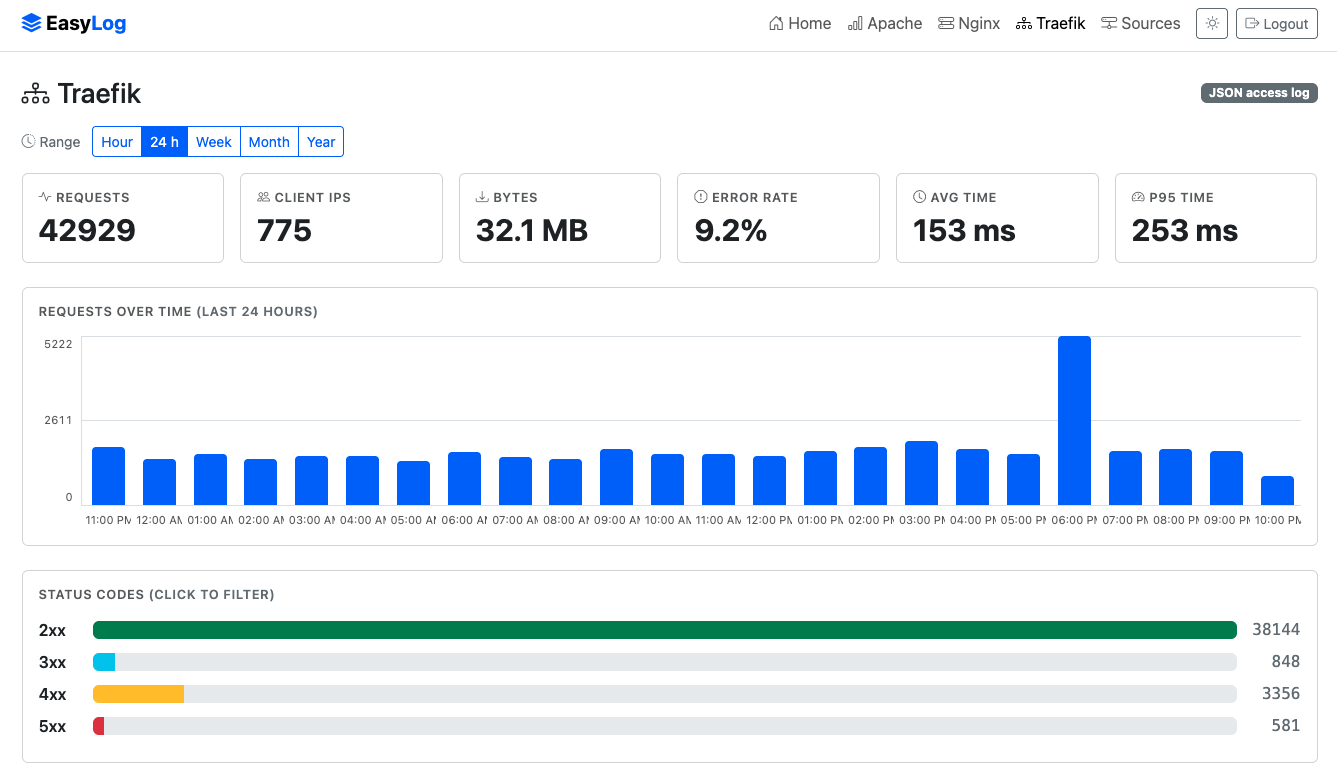
- A dashboard per log type — KPI cards, a requests timeline, status-code breakdowns, and top-N tables, with click-to-filter drill-down and a time-range selector (hour / 24h / week / month / year).
- IP geolocation, fully offline — every client IP is resolved to a country at ingest, driving a Countries KPI, a Top-countries panel, and a shaded world map you can click to filter. The country database is bundled in the binary; no lookups leave the machine.
- Overview home page — cross-type KPIs (total logs, logs/min, countries), a world map across all log types, and pie charts by source, type, and country.
- Authentication — admin account created on first run; the web UI is login-protected. Syslog ingestion stays open.
- Single self-contained binary — templates and assets are compiled in; nothing to install alongside it. Light/dark theme, fully offline (no CDN).
- First-class packaging —
.deband.rpmfor x86_64 and arm64, with a systemd unit.
Supported log types
| Log source | Format | Dashboard highlights |
|---|---|---|
| Apache HTTPD | Common / Combined | Requests, status codes, top URLs & client IPs |
| Nginx | Combined access log | Requests, status codes, top URLs & client IPs |
| Traefik | JSON access log | The above plus top routers/services and avg & p95 request duration |
Adding more types is by design
A new log type is a self-contained module (parser + storage + dashboard). Apache and Nginx share the same combined-format engine; Traefik adds router/service/duration panels on top.
Installation
EasyLog ships as a single binary and installs a service that starts on boot. Install it from the EasySYS package repository so upgrades come through your package manager. Packages are published for x86_64 and arm64; your package manager picks the right one.
# Add the EasyLog repository (signed)
curl -fsSL https://repo.easysys.io/easylog/stable/debian/key.gpg \
  | sudo gpg --dearmor -o /usr/share/keyrings/easysys.gpg
echo "deb [signed-by=/usr/share/keyrings/easysys.gpg] https://repo.easysys.io/easylog/stable/debian ./" \
  | sudo tee /etc/apt/sources.list.d/easylog.list

sudo apt update
sudo apt install easylog
sudo systemctl enable --now easylog
For air-gapped hosts, grab the .deb or .rpm for your architecture from the
releases page:
sudo dpkg -i easylog_*_amd64.deb     # or _arm64.deb
sudo rpm  -i easylog-*.x86_64.rpm    # or .aarch64.rpm
sudo systemctl enable --now easylog
Upgrades then mean downloading the next package by hand — the repository is the easier path where the host has network access.
The package installs the binary to /usr/bin/easylog, a default config to /etc/easylog/easylog.toml, and a systemd unit; the database lives in /var/lib/easylog. The service runs as root (standard for a syslog collector binding port 514).
Then open http://<host>:3000/ — on first run you'll be prompted to create the admin account, after which the UI requires login.
Configuration
EasyLog reads /etc/easylog/easylog.toml (override the path with the EASYLOG_CONFIG environment variable):
syslog_bind = "0.0.0.0"   # address the UDP + TCP listeners bind to
syslog_port = 514         # standard syslog; use 5514 to run without privileges
web_port    = 3000        # web UI / dashboards
db_path     = "/var/lib/easylog/easylog.duckdb"
geo_db_path = ""          # external MaxMind .mmdb; empty = bundled DB-IP Lite
Note
Log sources are not configured here — they're managed in the web UI (next section), so you never have to edit and reload a file to add a host.
Sending logs to EasyLog
There are two steps: tell EasyLog which host sends which log type, then forward the logs.
1. Register the source
In the web UI, open Sources (/sources) and add the sending host's IP address with its log type (apache, nginx, or traefik). EasyLog routes incoming syslog by source IP — traffic from unregistered hosts is dropped.
2. Forward the logs
Point the host's log file at EasyLog's syslog port with rsyslog's imfile module. Polling mode is recommended for reliability inside containers.
/etc/rsyslog.d/60-easylog.conf on the web server:
module(load="imfile" mode="polling" pollingInterval="2")

input(type="imfile"
      File="/var/log/apache2/access.log"   # nginx: /var/log/nginx/access.log
      Tag="apache"
      ruleset="easylog_forward")

ruleset(name="easylog_forward") {
    action(type="omfwd" target="EASYLOG_IP" port="514"
           protocol="udp" template="RSYSLOG_ForwardFormat")
}
Apply and restart:
Log format & reverse proxies
EasyLog parses both Common and Combined access-log formats — Nginx's default combined and Apache's combined/common all work out of the box. If a host sits behind a reverse proxy, configure it to log the real client IP (e.g. mod_remoteip / X-Forwarded-For) so the dashboards show visitors rather than the proxy.
Dashboards
Each log type has its own dashboard, and the home page rolls everything up:
- KPI cards — requests, unique client IPs, bytes served, error rate (and avg/p95 duration for Traefik).
- Requests over time — a zero-filled timeline that spans the whole selected range, shown in your browser's local timezone.
- Status codes — 2xx / 3xx / 4xx / 5xx breakdown; click a class to filter.
- Top URLs & client IPs (and routers / services for Traefik) — click any row to filter the whole dashboard. Filters stack and are shareable by URL.
- Requests by country — a Top countries panel and a world map shaded by request volume; hover a country for its exact count, click it to filter.
Use the time-range buttons (Hour · 24h · Week · Month · Year) to bound everything, and click chart elements to drill in — the URL captures the active filters, so views are bookmarkable.
Where your traffic comes from
Each client IP is resolved to a country as the log line is ingested, so every dashboard — and the home overview — can show traffic geographically.
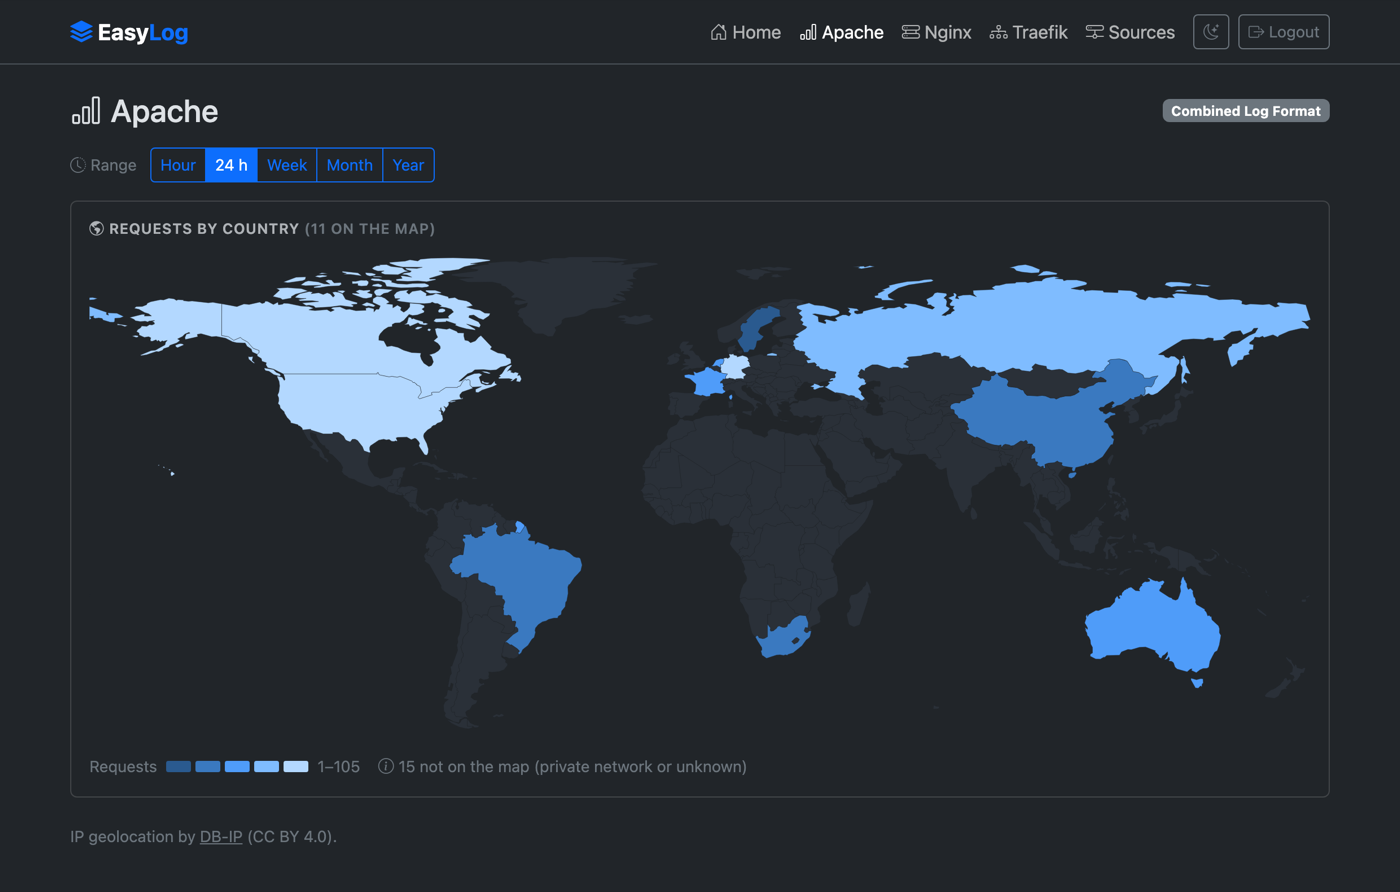
The shading uses a logarithmic scale, so a single dominant country doesn't flatten everything else into one shade. Clients that can't be placed on the map — private-network addresses (10.0.0.0/8, 192.168.0.0/16, …) and unresolved IPs — are never silently dropped: they're counted under the map and listed in the Top-countries panel as Private network and Unknown.
The map composes with everything else on the page: pick a range, click a status class, then click a country, and the KPIs, timeline, and tables all follow. Country filters appear as removable chips like any other filter.
Lookups are offline, and swappable
EasyLog bundles the DB-IP Lite country database in the binary — nothing to install, and no IP ever leaves your machine. To use a fresher or more detailed database, point geo_db_path at any MaxMind-format .mmdb (e.g. MaxMind GeoLite2) and restart. Countries are resolved at ingest time, so a database change applies to newly received logs, not to rows already stored.
Why EasyLog
- Memory-safe core — written in Rust on the Axum framework for speed and safety.
- No heavy database — DuckDB is embedded; there's no separate server to run, yet it's built for fast aggregation over millions of rows.
- Operationally simple — one binary, one config file, systemd-managed, packaged for the Debian and RHEL families on both x86_64 and arm64.
Bundled data
- IP geolocation by DB-IP — the DB-IP Lite country database, licensed CC BY 4.0.
- Country boundaries from Natural Earth (public domain).